Pivot Module
The Pivot analytic module is used to view one or more properties based on a specific 'pivot' - such as a different property or events.
They're often used for analysing production based on a systems mode, product, batch, shift/crew, position, or a range of other criteria. They can also be helpful when analysing loading, filling or other product transfer operations.
Starting Out
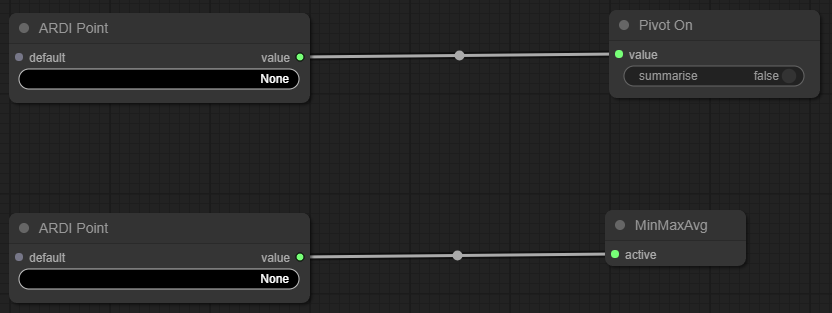
When you first create a new pivot, you'll see the graph below…
The node on the top-right is a Pivot node. All of the values in the analytic are grouped by the value you feed into this node.
If you want to split your values by if a machine is running or not, you can use a ARDI status. If you want to split by distance, you can use a ARDI Point and a Round node.
You can also pivot by events with an ARDI Event Name node.
The node on the bottom-right is an Pivot Output node. This represents a channel of data that will be split up across each of the pivot values.
For example, if you wanted to see the different speeds your machine ran at on different days of the week, you'd connect Day of the Week to your Pivot node and speed to the Output node.
