Line Tracking Module
The Line Tracking analytic module is used to track the progress of a product, batch start, fault or other point of interest along a moving path through your system.
It has significant benefits in applications such as production lines and conveyors.
Tracking allows people to build synchronised reporting and can have applications in system modelling.
Starting Out
This analytic varies from many others in that the initial layout is based on your relationships. When you initially create your analytic, you'll not only choose an ARDI asset, but also a relationship that represents the path of your product through the system.
The system creates a Tracking Point for each of the assets along the relationship path.
Tracking Point Properties
Each tracking point has several different inputs, and a single destination output.
You use destination and input to connect each of your nodes in the order they appear in your system. The destination of node A feeds into the input of node B, and so-on down the relationship until it reaches the end.
The other three inputs to each tracking point are…
| Name | Description |
|---|---|
| Speed | The speed of the line at this point |
| Size | The length of the line between this point and the next (the len option will be used if this isn't connected) |
| Active | Indicates if this part of the line is running and available. This is used if you have branches in your line - a product will flow down the line into the active asset. |
Connecting Speed
It isn't required to connect the speed on every node. When no speed is specified, the system uses the speed of the previous node that has a speed input.
On a line that has a consistent speed throughout, you might only connect the speed of the first node - it will then flow down to all of the others.
Varying Sizes
Most systems such as this have fixed lengths between assets - the conveyor between A and B is always 30m long.
However, there are some cases where lines have moving loaders, accumulators, hoppers, and variable storage. This is why the system allows you to adjust the size (ie. length) of each of the assets.
Scaling Output
The Options node is used to interact with the tracking system as a whole.
The most important element is the multiplier option. This specifies an overall multiplier you'd like to apply to your line speeds.
For example, if your speed is in meters per minute, a multiplier of '1/60' (0.01666) can be used to bring your line speeds down to meters per second, which is needed by the tracking analytic.
Dropping Hotspots
Tracking works by dropping what are called hotspots. A hotspot is a point that will be tracked along the relationship.
For each hotspot, you get a list of when the point passes each asset along the graph.
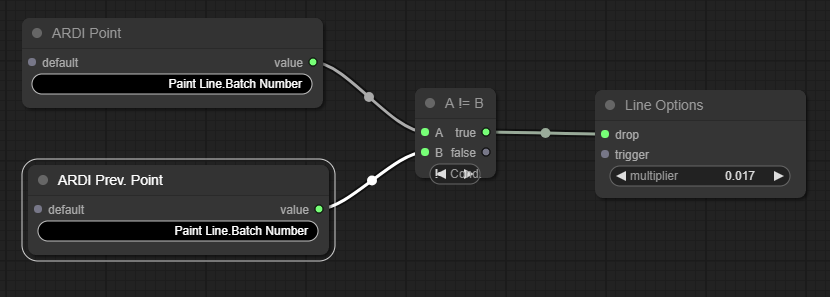
You'll have one hotspot that 'drops' at the start of the reporting range, but you can also drop more hotpots based on triggers.
For example, if you'd like to track the start of batches, you could use logic to set up a 'drop' when the batch number changes…
Output
The output of the analytic is a list of hotspots (in the example above, one for every batch) that indicates where the head of that batch passes each of our assets.
This can then be used to create synchronised or length-based reporting - showing values from sensors as the product passes the sensor.

